grafana/public/app/plugins/panel/traces
Joey 4f46fb412c
Tempo: Embed flame graph in span details (#77537)
* Embed flame graph

* Update test

* Update test

* Use toggle

* Update test

* Add tests

* Use const

* Cleanup

* Update profile tag

* Move flame graph out of tags, remove request and other cleanup + tests

* Update test

* Set flame graph by profile id and simplify logic

* Cleanup and redrawListView

* Create/use feature toggle
2023-11-23 13:36:53 +00:00
..
img Traces Panel: Add new Traces Panel visualization (#47534) 2022-05-03 17:42:36 +01:00
module.tsx Traces Panel: Add new Traces Panel visualization (#47534) 2022-05-03 17:42:36 +01:00
plugin.json Chore: Remove the beta badge for Node Graph and Traces (#62566) 2023-02-27 15:16:01 +01:00
README.md Chore: Add a README for Traces in the Plugins section (#54903) 2022-09-09 12:56:05 +01:00
TracesPanel.test.tsx Traces Panel: Add new Traces Panel visualization (#47534) 2022-05-03 17:42:36 +01:00
TracesPanel.tsx Tempo: Embed flame graph in span details (#77537) 2023-11-23 13:36:53 +00:00

Traces

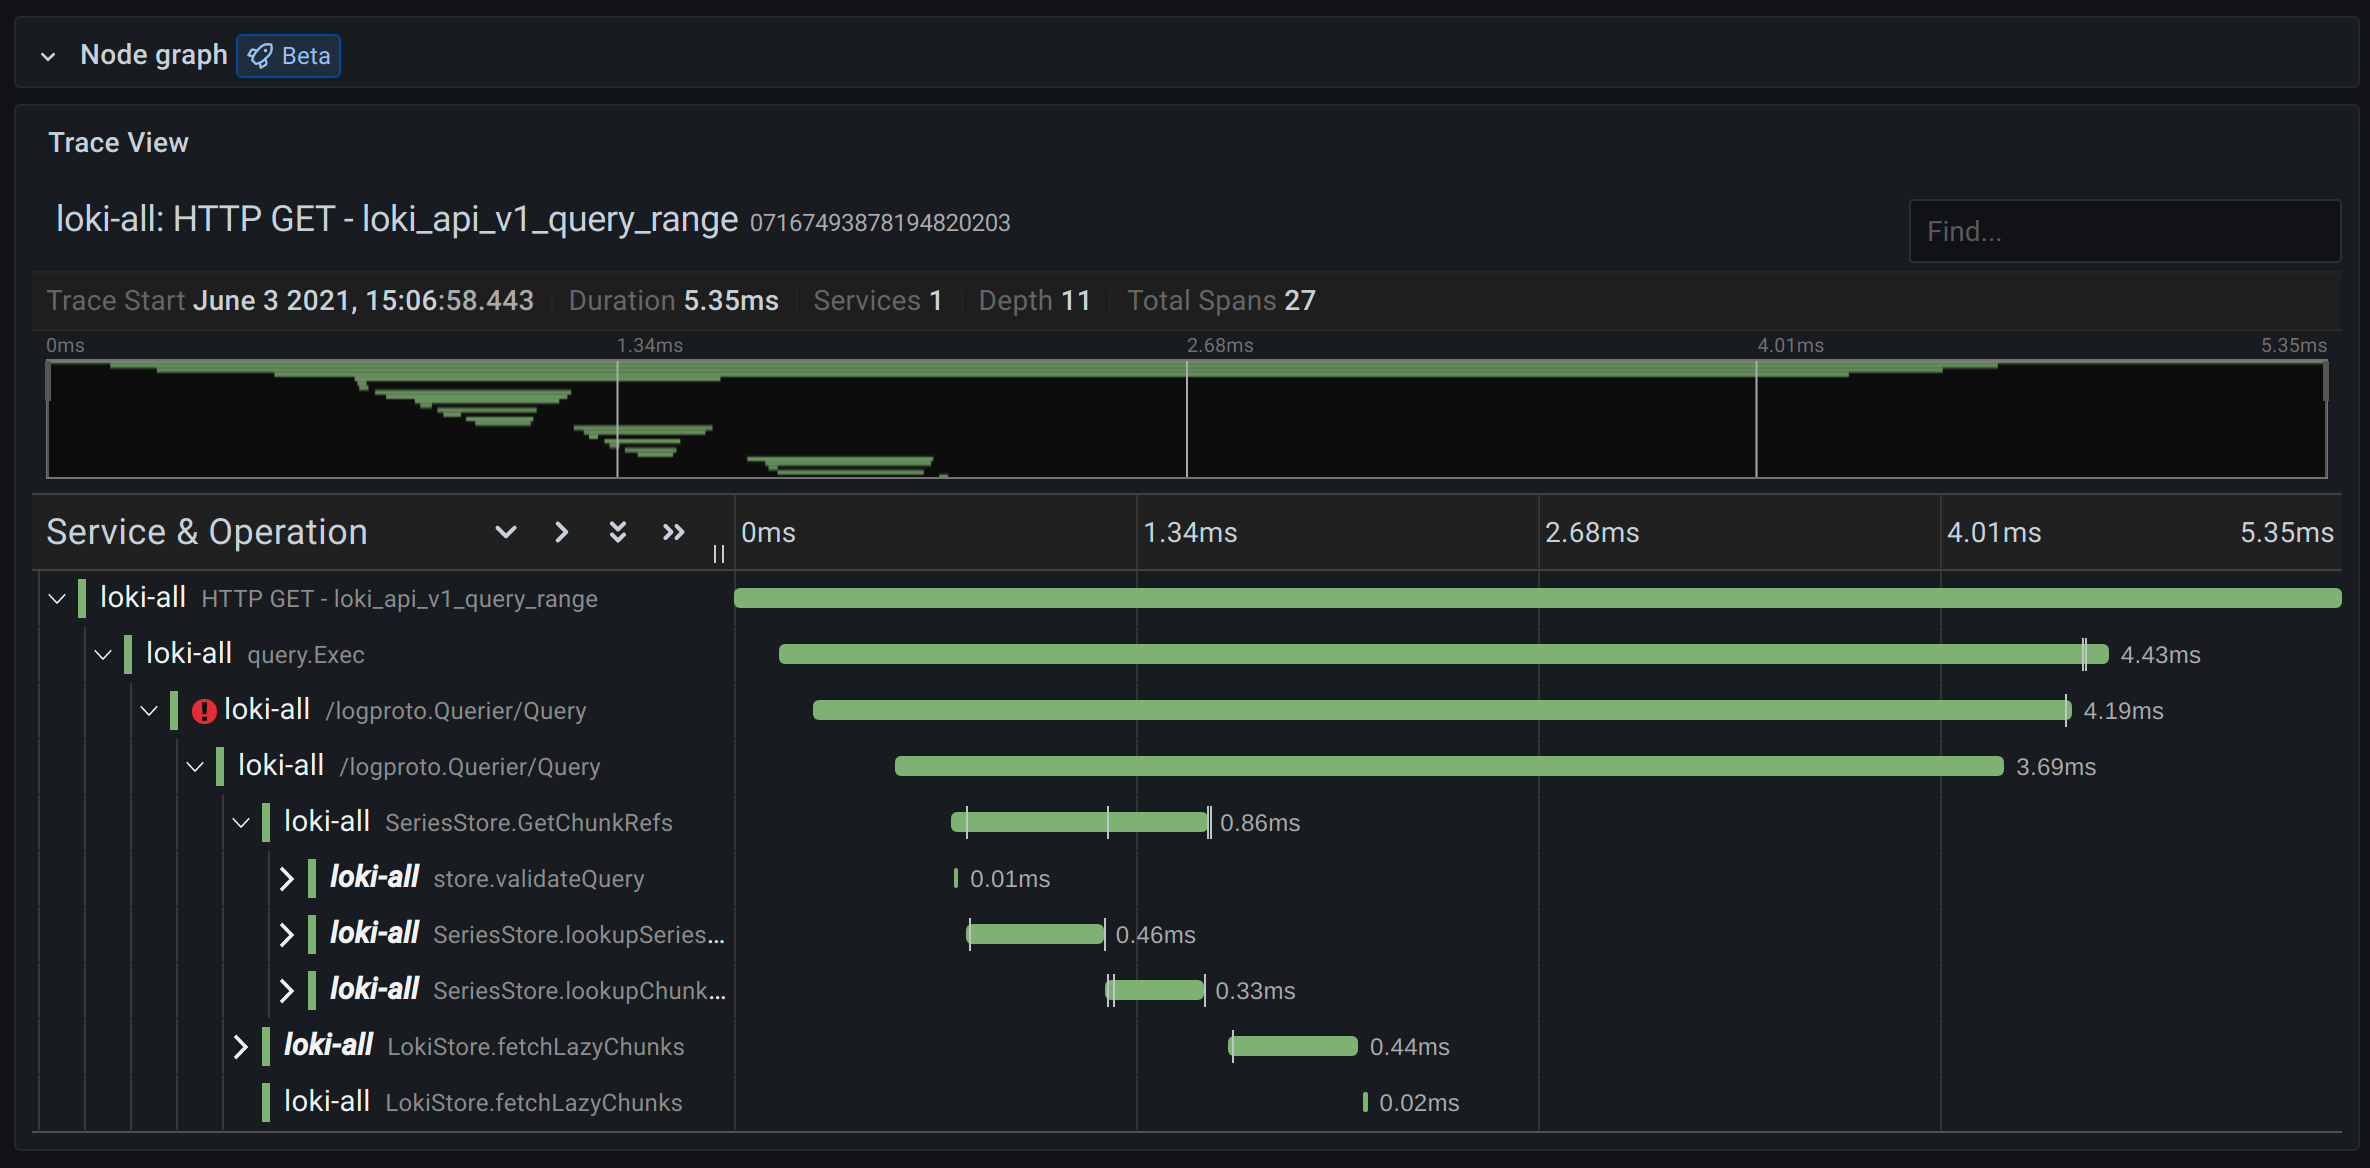
A trace is a type of visualization that enables you to track and log a request as it traverses the services in your infrastructure.

The screenshot below shows an example of a trace view in Grafana. You can learn more about traces here.

Example of a trace view