2016-01-14 17:33:53 +01:00
|
|
|
# Health
|
|
|
|
|
|
|
|
|
|
This view will help you to find any bottleneck or to compare the metrics of your infrastructure.
|
2016-01-14 17:33:09 +01:00
|
|
|
|
2016-01-14 17:34:34 +01:00
|
|
|
### Heatmap
|
|
|
|
|
|
|
|
|
|
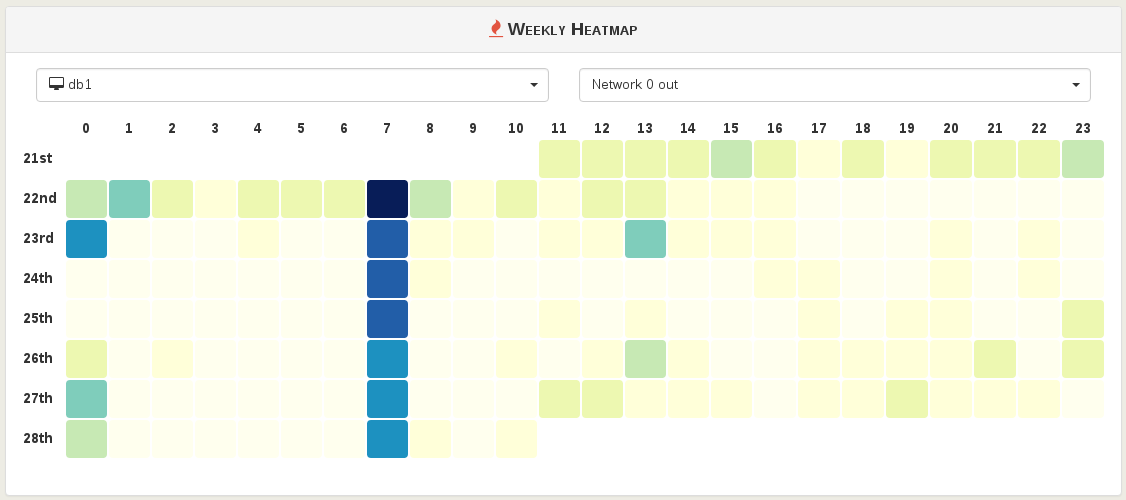
A heatmap allows its reader to understand when your VMs or hosts are stressed. Values are relative, thus it's easy to detect trends or spikes.
|
|
|
|
|
|
|
|
|
|
[](https://xen-orchestra.com/blog/xen-orchestra-4-4/#heatmapforinfrastructurehealth).
|
|
|
|
|
|
2016-01-14 17:35:51 +01:00
|
|
|
### Event correlation
|
|
|
|
|
|
|
|
|
|
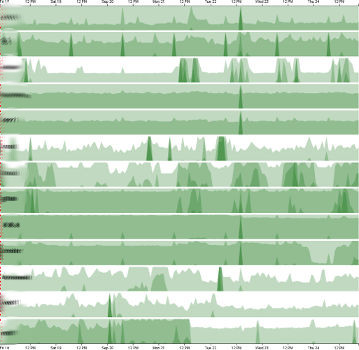
This is the place to compare metrics on comparable objects (VMs to VMs, hosts to hosts).
|
|
|
|
|
|
|
|
|
|
[](https://xen-orchestra.com/blog/xen-orchestra-4-6#eventcorrelation).
|
