mirror of
https://github.com/grafana/grafana.git
synced 2025-02-25 18:55:37 -06:00
146 lines
5.2 KiB
Markdown
146 lines
5.2 KiB
Markdown
[Grafana](http://grafana.org) [](https://circleci.com/gh/grafana/grafana) [](https://coveralls.io/r/grafana/grafana) [](https://gitter.im/grafana/grafana?utm_source=badge&utm_medium=badge&utm_campaign=pr-badge&utm_content=badge)
|
|
================
|
|
[Website](http://grafana.org) |
|
|
[Twitter](https://twitter.com/grafana) |
|
|
[IRC](https://webchat.freenode.net/?channels=grafana) |
|
|
[Email](mailto:contact@grafana.org)
|
|
|
|
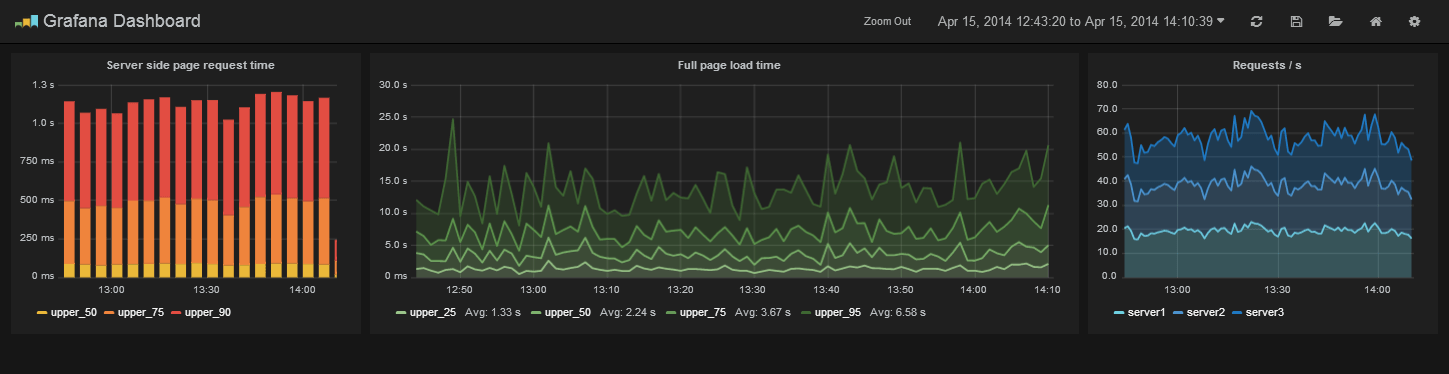
Grafana is an open source, feature rich metrics dashboard and graph editor for
|
|
Graphite, Elasticsearch, OpenTSDB, Prometheus and InfluxDB.
|
|
|
|
|
|
|
|
- [Install instructions](http://docs.grafana.org/installation/)
|
|
- [What's New in Grafana 2.0](http://docs.grafana.org/guides/whats-new-in-v2/)
|
|
- [What's New in Grafana 2.1](http://docs.grafana.org/guides/whats-new-in-v2-1/)
|
|
- [What's New in Grafana 2.5](http://docs.grafana.org/guides/whats-new-in-v2-5/)
|
|
|
|
## Features
|
|
### Graphite Target Editor
|
|
- Graphite target expression parser
|
|
- Feature rich query composer
|
|
- Quickly add and edit functions & parameters
|
|
- Templated queries
|
|
- [See it in action](http://docs.grafana.org/datasources/graphite/)
|
|
|
|
### Graphing
|
|
- Fast rendering, even over large timespans
|
|
- Click and drag to zoom
|
|
- Multiple Y-axis, logarithmic scales
|
|
- Bars, Lines, Points
|
|
- Smart Y-axis formatting
|
|
- Series toggles & color selector
|
|
- Legend values, and formatting options
|
|
- Grid thresholds, axis labels
|
|
- [Annotations](http://docs.grafana.org/reference/annotations/)
|
|
- Any panel can be rendered to PNG (server side using phantomjs)
|
|
|
|
### Dashboards
|
|
- Create, edit, save & search dashboards
|
|
- Change column spans and row heights
|
|
- Drag and drop panels to rearrange
|
|
- [Templating](http://docs.grafana.org/reference/templating/)
|
|
- [Scripted dashboards](http://docs.grafana.org/reference/scripting/)
|
|
- [Dashboard playlists](http://docs.grafana.org/reference/playlist/)
|
|
- [Time range controls](http://docs.grafana.org/reference/timerange/)
|
|
- [Share snapshots publicly](http://docs.grafana.org/v2.0/reference/sharing/)
|
|
|
|
### Elasticsearch
|
|
- Feature rich query editor UI
|
|
|
|
### InfluxDB
|
|
- Use InfluxDB as a metric data source, annotation source
|
|
- Query editor with series and column typeahead, easy group by and function selection
|
|
|
|
### OpenTSDB
|
|
- Use as metric data source
|
|
- Query editor with metric name typeahead and tag filtering
|
|
|
|
## Requirements
|
|
There are no dependencies except an external time series data store. For dashboards and user accounts Grafana can use an embedded
|
|
database (sqlite3) or you can use an external SQL data base like MySQL or Postgres.
|
|
|
|
## Installation
|
|
Head to [grafana.org](http://docs.grafana.org/installation/) and [download](http://grafana.org/download/)
|
|
the latest release.
|
|
|
|
If you have any problems please read the [troubleshooting guide](http://docs.grafana.org/installation/troubleshooting/).
|
|
|
|
## Documentation & Support
|
|
Be sure to read the [getting started guide](http://docs.grafana.org/guides/gettingstarted/) and the other feature guides.
|
|
|
|
## Run from master
|
|
If you want to build a package yourself, or contribute. Here is a guide for how to do that. You can always find
|
|
the latest master builds [here](http://grafana.org/download/builds)
|
|
|
|
### Dependencies
|
|
|
|
- Go 1.5
|
|
- NodeJS
|
|
|
|
### Get Code
|
|
|
|
```
|
|
go get github.com/grafana/grafana
|
|
```
|
|
|
|
### Building the backend
|
|
Replace X.Y.Z by actual version number.
|
|
```
|
|
cd $GOPATH/src/github.com/grafana/grafana
|
|
go run build.go setup (only needed once to install godep)
|
|
godep restore (will pull down all golang lib dependencies in your current GOPATH)
|
|
go run build.go build
|
|
```
|
|
|
|
### Building frontend assets
|
|
|
|
To build less to css for the frontend you will need a recent version of of node (v0.12.0),
|
|
npm (v2.5.0) and grunt (v0.4.5). Run the following:
|
|
|
|
```
|
|
npm install
|
|
npm install -g grunt-cli
|
|
grunt
|
|
```
|
|
|
|
### Recompile backend on source change
|
|
To rebuild on source change (requires that you executed godep restore)
|
|
```
|
|
go get github.com/Unknwon/bra
|
|
bra run
|
|
```
|
|
|
|
### Running
|
|
```
|
|
./bin/grafana-server
|
|
```
|
|
|
|
Open grafana in your browser (default http://localhost:3000) and login with admin user (default user/pass = admin/admin).
|
|
|
|
### Dev config
|
|
|
|
Create a custom.ini in the conf directory to override default configuration options.
|
|
You only need to add the options you want to override. Config files are applied in the order of:
|
|
|
|
1. grafana.ini
|
|
2. dev.ini (if found)
|
|
3. custom.ini
|
|
|
|
## Create a pull request
|
|
Before or after you create a pull request, sign the [contributor license agreement](http://grafana.org/docs/contributing/cla.html).
|
|
|
|
## Contribute
|
|
If you have any idea for an improvement or found a bug do not hesitate to open an issue.
|
|
And if you have time clone this repo and submit a pull request and help me make Grafana
|
|
the kickass metrics & devops dashboard we all dream about!
|
|
|
|
Before creating a pull request be sure that "grunt test" runs without any style or unit test errors, also
|
|
please [sign the CLA](http://docs.grafana.org/project/cla/)
|
|
|
|
## License
|
|
|
|
Grafana is distributed under Apache 2.0 License.
|
|
Work in progress Grafana 2.0 (with included Grafana backend)
|
|
|