855 B
855 B
Visualizations
Visualization are available since 4.4
Visualizations help you to understand your own XenServer infrastructure, to correlate event and detect bottlenecks.
Dashboard
The dashboard is a view gathering information on all your connected pools/hosts.
You can also update all your hosts (install missing patches) from this place.
Sunburst
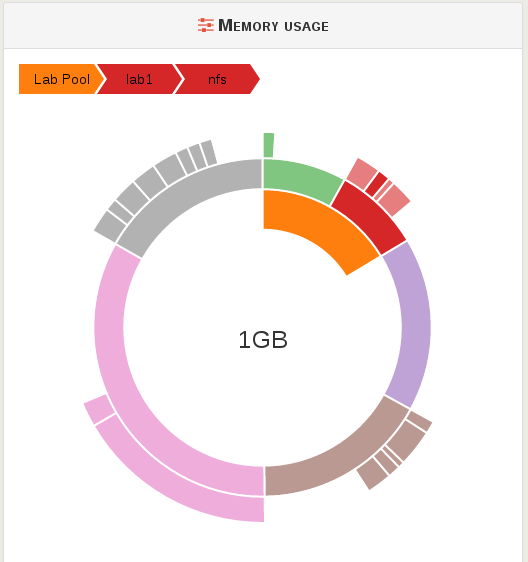
A sunburst visualization helps a lot to detect proportions in a hierarchical environment. Two cases with XenServer:
- VM disk usage in storage repositories
- VM RAM usage in hosts

