1.3 KiB
1.3 KiB
Visualizations
Visualizations help you to understand your own XenServer infrastructure, to correlate event and detect bottlenecks.
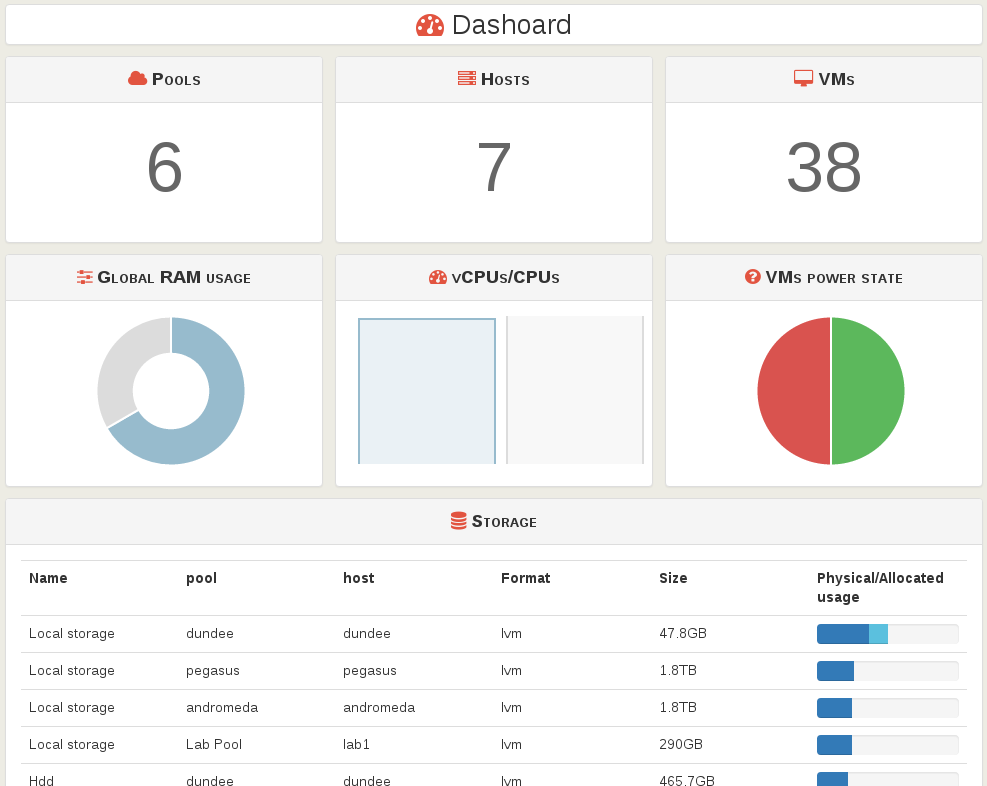
Dashboard
The dashboard is a view gathering information on all your connected pools/hosts.
 .
.
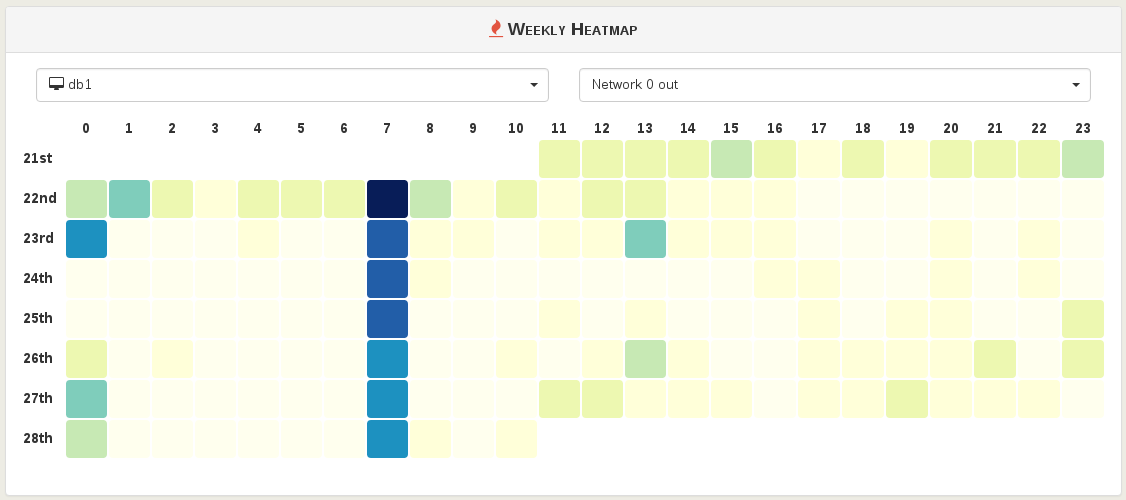
Heatmap
A heatmap allows its reader to understand when your VMs or hosts are stressed. Values are relative, thus it's easy to detect trends or spikes.
 .
.
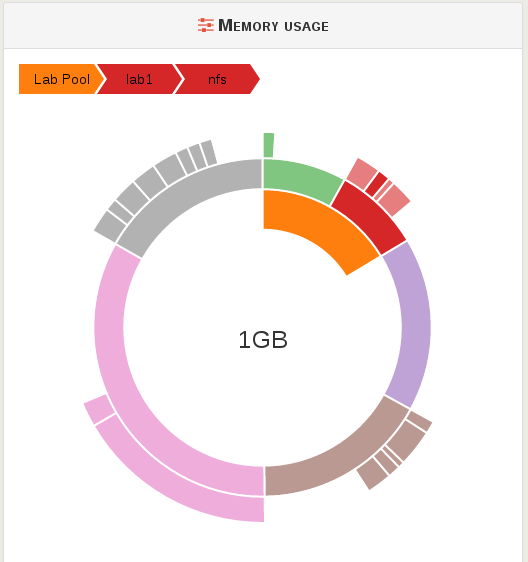
Sunburst
A sunburst visualization helps a lot to detect proportions in a hierarchical environment. Two cases with XenServer:
- VM disk usage in storage repositories
- VM RAM usage in hosts
 .
.
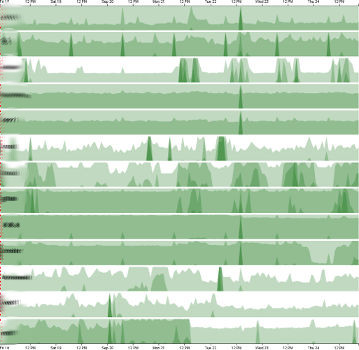
Event correlation
This is the place to compare metrics on comparable objects (VMs to VMs, hosts to hosts).
 .
.